
We’ve all heard it before that Salesforce is a Multi-Tenant platform, and therefore, we need to ensure that the Salesforce Instance/Org is configured to adhere to the best practices. Salesforce offers a tool known as “Salesforce Optimizer Report”, which provides a health check for a Salesforce Instance. Salesforce has enhanced this further to an independent Application that can be accessed via the App Launcher.
You may also wave a final goodbye to the amazing PDF that is currently being generated to provide us with insights on the Salesforce Implementation in an Instance.
When using the Salesforce Optimizer App please consider the following:
- Metadata related to managed packages are not evaluated
- Optimizer evaluates your org’s metadata only, it does not evaluate records or other contents stored in Salesforce
- Take a look at some of the features that are analyzed by Salesforce with the Salesforce Optimizer App as compared to the Salesforce Optimizer PDF that people have referred to most recently
- Optimizer evaluates users only with the following licenses –
- Chatter Only (Chatter Plus)
- Company Community User
- Lightning Platform App Subscription
- Lightning Platform – One App
- Knowledge Only User
- Salesforce
- Salesforce Platform
One may consider running Salesforce Optimizer as part of your monthly maintenance, before installing a new app, before each Salesforce release, or at least once a quarter. One can run the report as often as they like in order to keep on top of maintenance activities. The App can also be set to run automatically on a monthly basis.
How to run the Salesforce Optimizer Report?
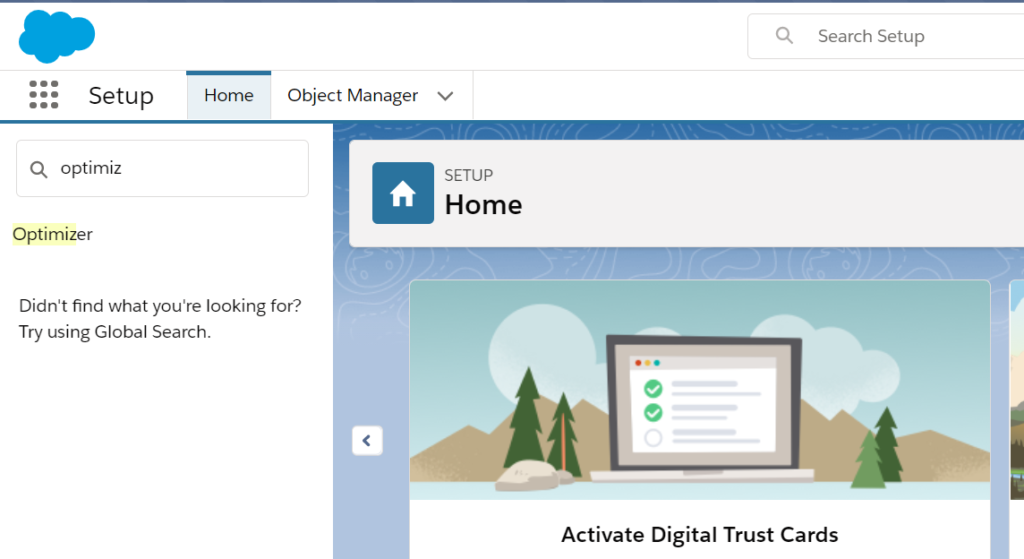
Step 1: From Setup, enter Optimizer in the Quick Find box, then select Optimizer.
Step 2: Enable Optimizer by allowing access, if you haven’t done so already.
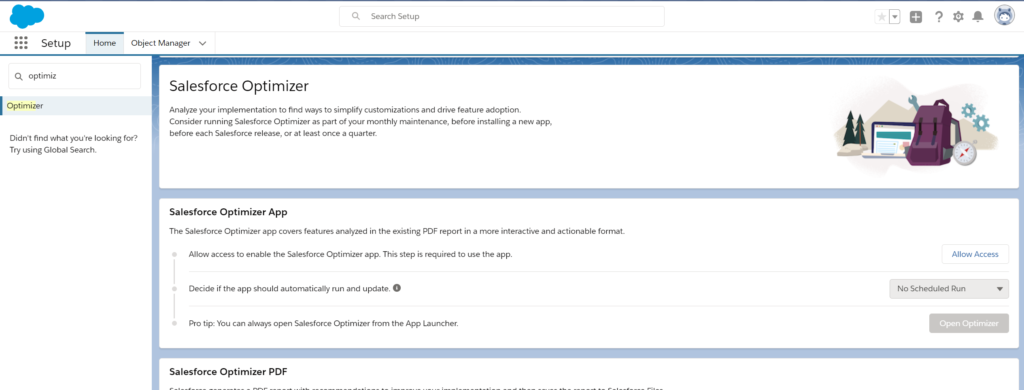
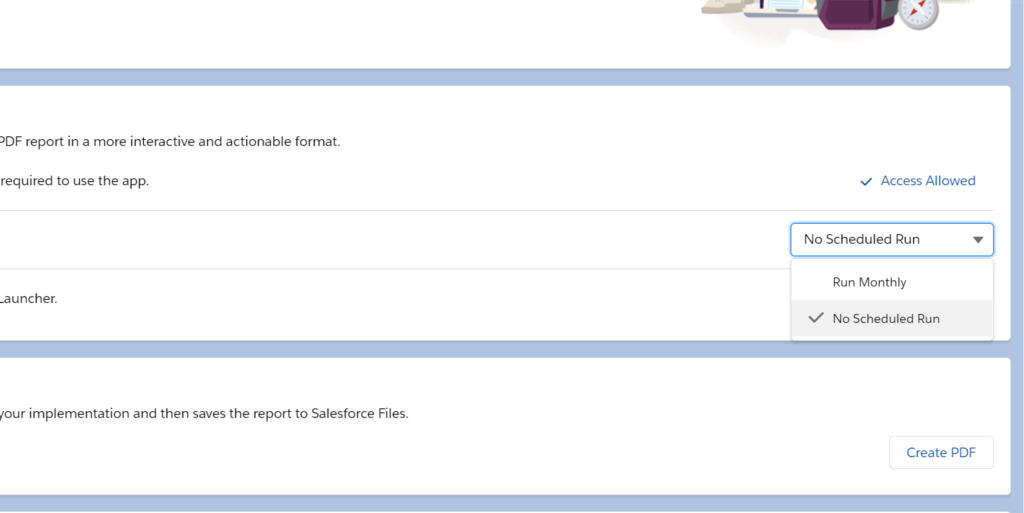
Step 3: Decide if the app should automatically run and update.
Step 4: Click Open Optimizer
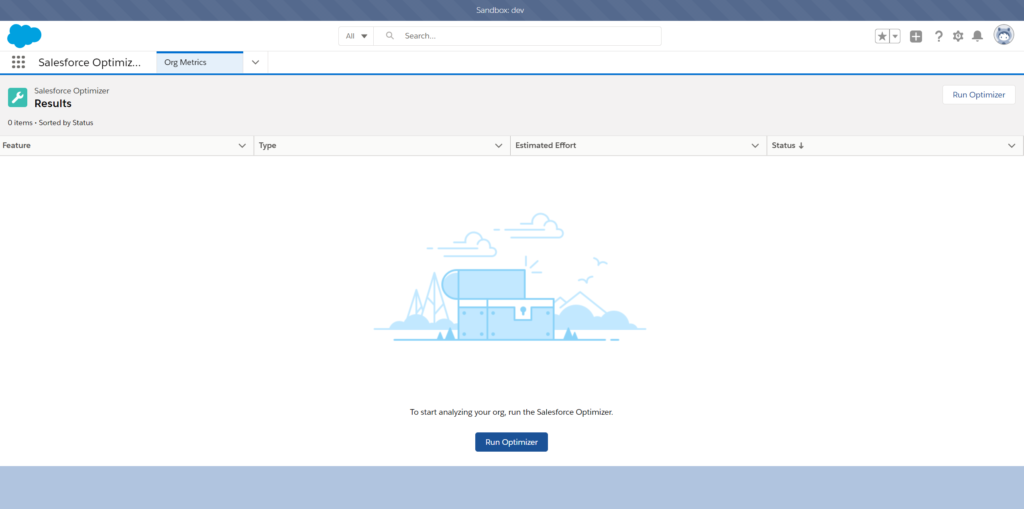
Step 5: Salesforce sends an in-app notification when results are ready. Access Optimizer results by clicking the notification. Or, return to the Optimizer in Setup to review your results.
Voila! It’s done!
In the App, Org Metric History is shown with graphs for file storage limits, data storage limits, and static resource limits. These graphs give a high-level visual overview of how these limits have impacted your org.
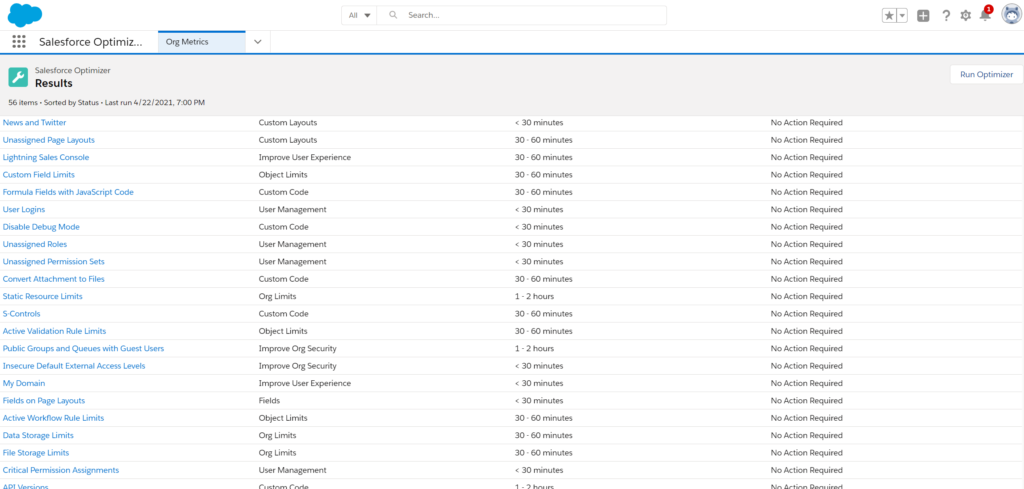
Salesforce also saves an “.xls” file in Salesforce Files. The file includes some of the information from the report:
- Feature section and subsection per the report’s table of contents
- Type of feature analyzed, along with the number of items found
- Severity of observation
Use the .xls file to load the data into Salesforce to analyze it for trending and historical analysis. By uploading data into a Salesforce custom object, you can create workflow triggers and alerts when various thresholds are reached.